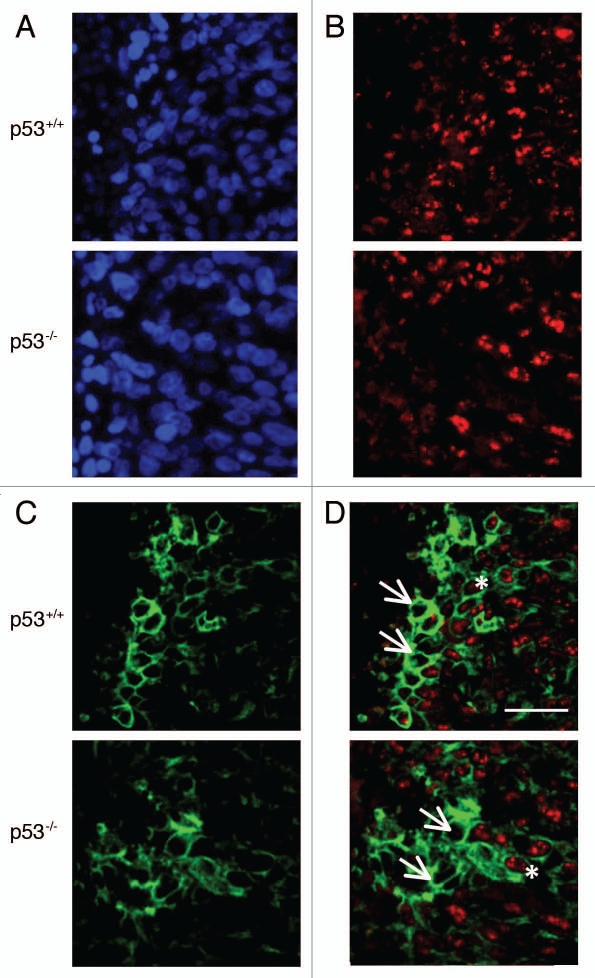
Figure 5.
Detection of DNMT1 and hypoxic regions in HCT116 xenografts by immunofluorescence. Blue channel is nuclear staining by DAPI (A), red channel is DNMT1 (B), green is CA IX/hypoxia marker (C), and overlay of DNMT1 and CA IX (D). Arrows indicate cells which are hypoxic and DNMT1 negative. Asterisks indicate cells which are both hypoxic and expressing DNMT1. Scale bar represents 50 µm.

