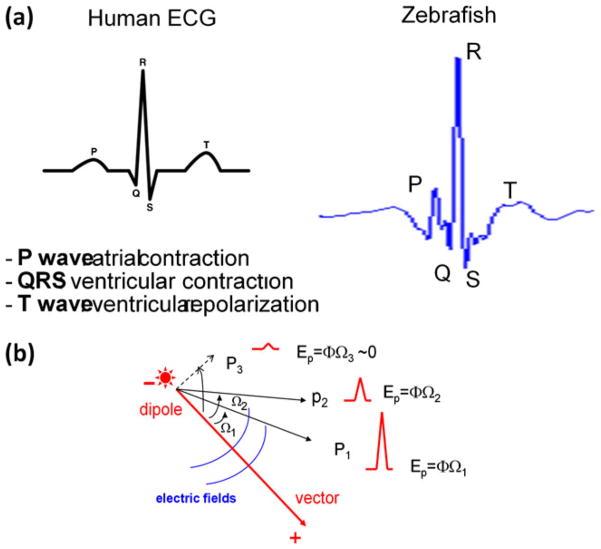
Fig. 7.
(a) Comparison between human and zebrafish ECG signals. Due to a smaller heart size and higher mean heart rates, the PR interval for zebrafish is shorter than that of humans. T waves usually display a biphasic pattern acquired from the pseudo-unipolar electrodes. (b) Lead placements in relation to the vector direction. QRS amplitudes in P1 and P2 are dependent on the electrode lead position. Ep denotes electric potential, Ω the solid angle, and Φ the strength of charge surface (Φ = voltage/unit of the solid angle)

