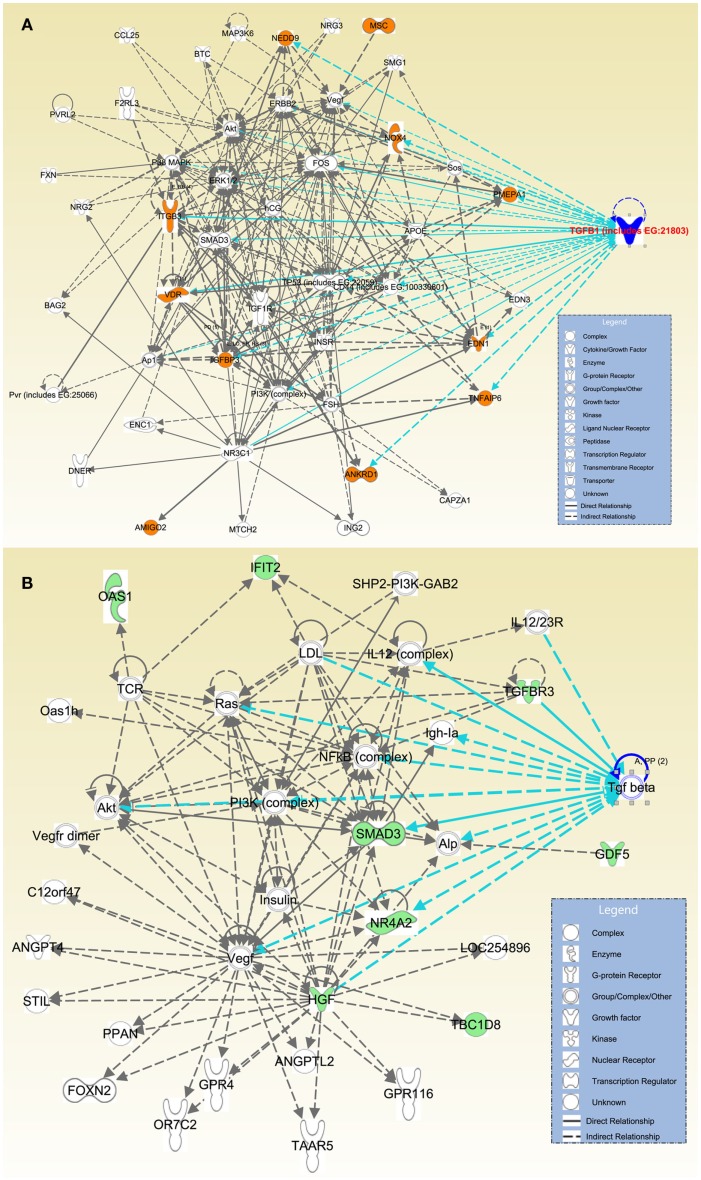
Figure 3.
Direct and indirect relations of most differentially expressed genes with TGFβ. Affymetrix probe identifiers and FC values of significantly altered transcripts (n = 27) were uploaded to IPA and each identifier was mapped to its corresponding gene object in the IKB. Interactions were then queried between these gene objects and all other gene objects stored within IPA to generate a set of direct interaction networks that were merged. Networks with the highest number of molecules were selected, overlaid with TGFβ molecules, and organized using Path Designer of IPA. Upregulated transcripts were highlighted with orange (A); and downregulated transcripts were highlighted with green (B). Types of molecules were annotated in the legend in the box.

