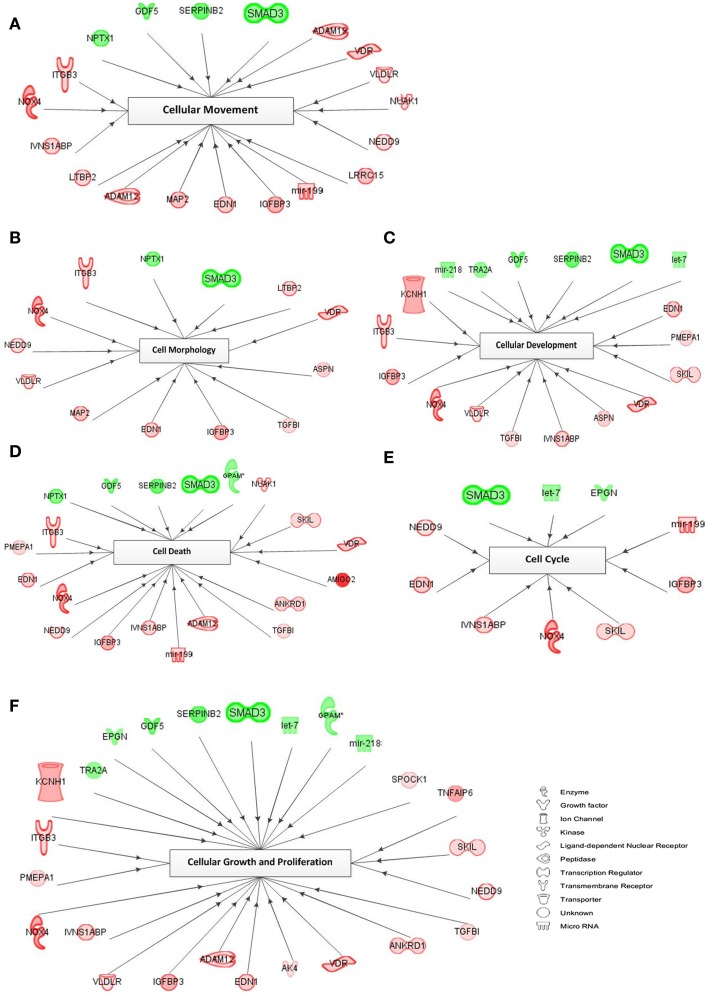
Figure 5.
Network of cellular biofunctions and corresponding transcripts. Networks were constructed with the IPA software using the selected genes matching the criterion of FC >2.0 and involved in cellular biofunctions. Several differentially regulated genes from the study were used to construct a gene association map for predicting various cellular and molecular events operating within the palatal mesenchyme (A–F). Red symbols specify upregulated expression of genes, whereas green symbols indicate downregulated genes. The color darkness represents the FC intensity.

