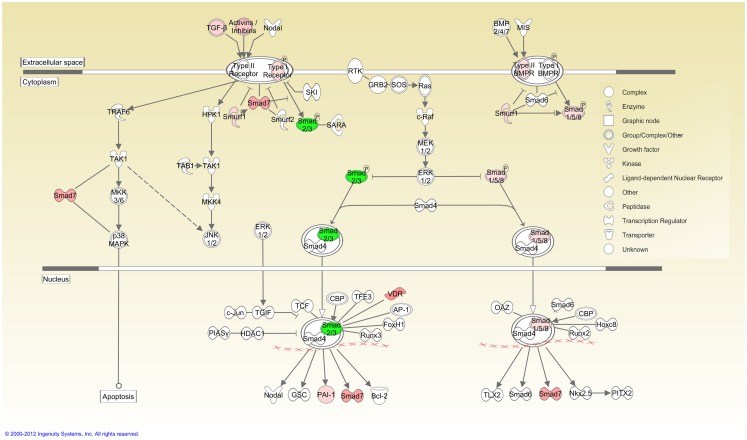
Figure 7.
TGFβ signaling pathway overlaid with differentially expressed genes. Cellular localization of differentially expressed genes active in canonical TGFβ pathway was illustrated using the IPA Path Designer. Genes in Table 1 were uploaded to IPA as a dataset and analyzed using default settings. Acquired networks were overlaid with TGFβ canonical pathway. The overlapping genes are: TGFβ1, TGFβ2, INHBA (activins/inhibins), BMPR2, SMAD7, SMURF1, SMAD 1/5/8, SMAD2/3, VDR, and PAI-1. Green color represents downregulated expression, whereas red color represents upregulated expression of genes. Color intensity reflects the level of expression. Types of molecules are annotated in the legend in the box.

