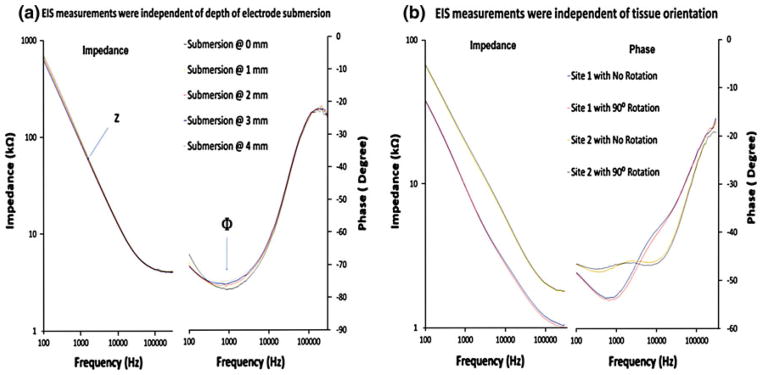
FIGURE 4.
EIS measurements in relation of the depth of microelectrode submersion and orientation of the specimens. (a) EIS and phase data of rabbit artery tissue submerged in PBS solution. The lowest impedance was about 4000 Ω at 300 kHz (left panel). The corresponding phase value was close to −15° indicating that the impedance was mostly in the ohmic resistance range (right panel). (b) EIS and phase data were compared between two sites. The impedance and phase readings were independent of the orientation of the specimens.

