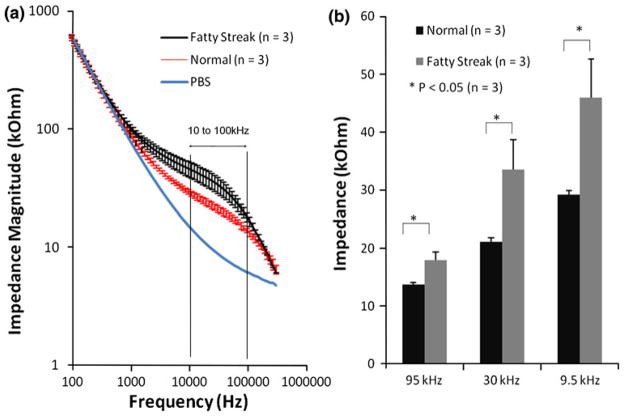
FIGURE 7.
Endoluminal EIS measurements from the human descending aorta. (a) EIS data results were performed on the thoracic aorta. Significantly higher impedance values were recorded from the fatty streaks over the frequency range from 10 to 100 kHz compared to the healthy endoluminal surface. (b) T-test verified the statistically significant difference in impedance measured at 95 kHz, 30 kHz, and 9.5 kHz between the healthy and plaque tissues (* p <0.05, n = 3).

