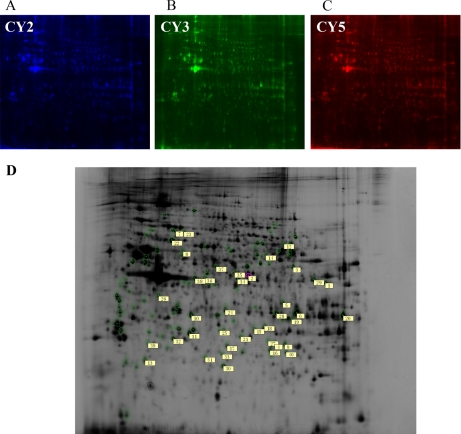
Fig. 3.
Representative 2D-DIGE gels showing the protein expression profiles obtained from anti-Thy1 nephritis. Proteins from the samples obtained for each group were differentially labeled with Cy3 and Cy5 (B, C). Equal amounts of each sample were combined and labeled with Cy2 and set as an internal standard (A). Labeled samples (50 μg of each of the Cy3- and Cy5-labeled samples and of the Cy2-labeled internal standard) were loaded onto 24-cm pH 3–11 NL-IPG strips and subjected to IEF. Proteins were further separated by SDS-PAGE (12.5%) in the second dimension. Numbers allocated by the DeCyder software indicate spots with significant changes in intensity (p < 0.05), which were identified by MALDI-TOF or LC-MS (D).

