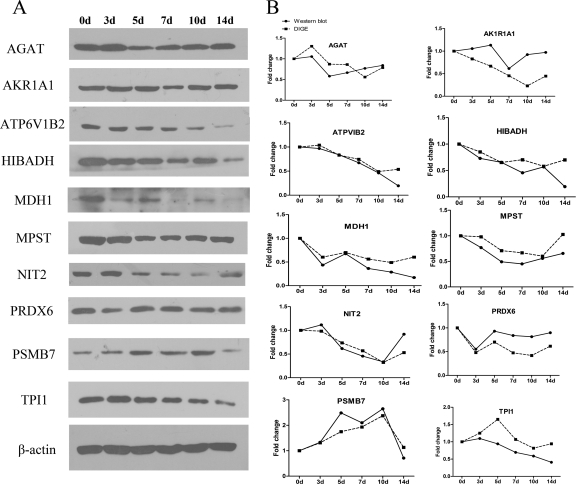
Fig. 5.
Validating DEP expression by Western blotting. The expression of 10 DEPs, distributed in five clusters, including AKR1A1, AGAT, ATP6V1B2, HIBADH, MDH1, MPST, NIT2, PRDX6, PSMB7, and TPI1, were validated by Western blotting. A, DEP expression changes during the process of anti-Thy1 were detected by Western blotting. B, DEPs' expression trends in DIGE were validated by Western blotting. The broken-line curve represents the expression change of DEPs analyzed by DIGE (expression of the control group was arbitrarily set as 1.0), and the full-line curve represents the densitometry analysis of DEPs' expression detected by Western blotting (the intensities of these protein bands are presented as their ratios to the β-actin levels and data from the control group were arbitrarily set as 1.0).

