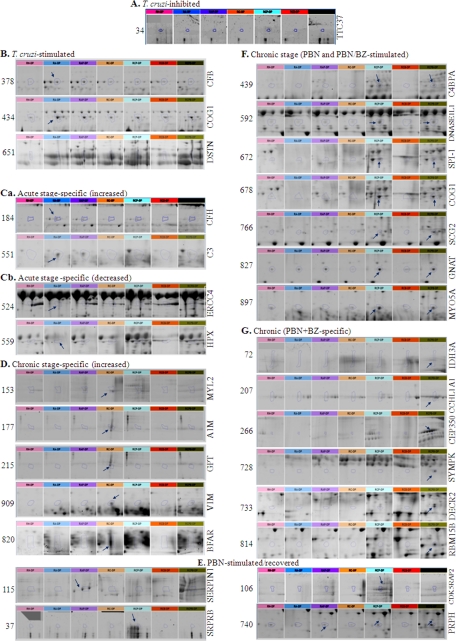
Fig. 2.
A–F, Shown is an expanded view of the 2D-gel images for selected plasma proteins that were altered in expression (>twofold) in response to T. cruzi infection, disease state, and/or treatment with PBN and BZ. The number on the left side represents the spot number identified on 2D-gels. The gene name of identified proteins, determined by mass spectrometry/BLAST analysis, is shown at right side. The detailed gene/protein names, along with spot numbers, are listed in Table I. Arrows mark the disease- or treatment-specific change in plasma proteins in chagasic rats. Abbreviations (color at top of each micrograph): RN, normal rats (pink); RA, acutely infected rats (blue); RAP, RA/PBN-treated (purple); RC, chronically infected rats (brown); RCP, RC/PBN-treated (mauve); RCB, RC/BZ-treated (red); and RCPB, RC/PBN+BZ-treated (green). The intensity of color is indicative of the extent of change in the protein level in chagasic plasma.

