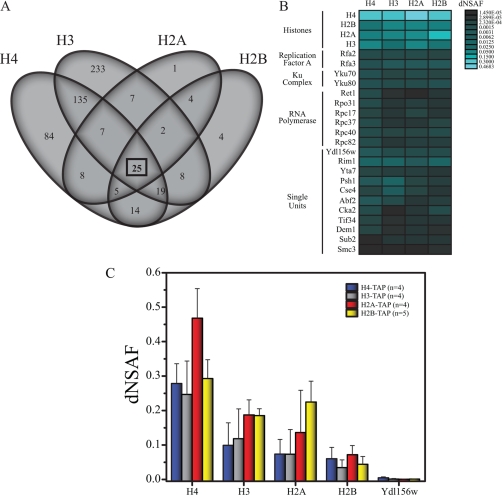
Fig. 1.
The identification of histone associated proteins. A, Venn diagram illustrating the shared nature of the histone core. Subunits common to all four baits are indicated by a black box. B, The relative abundance of the prey proteins in the core histones represented by dNSAF. Average dNSAF values for 25 preys that were shared by all histones and scored highly in the first singular vector of the SVD analysis. The blue color intensity is indicative of the dNSAF value according to the scale shown at the right side of the heat map. High dNSAFs are represented by the light blue whereas low dNSAF values correspond to dark blue. C, Relative protein abundance determined for the core histones as obtained from the H4 (n = 4 biological replicates), H3 (n = 4 biological replicates), H2A (n = 4 biological replicates), and H2B (n = 5 biological replicates) TAP purifications. Data in (C) is expressed as average dNSAF values + standard deviations.

