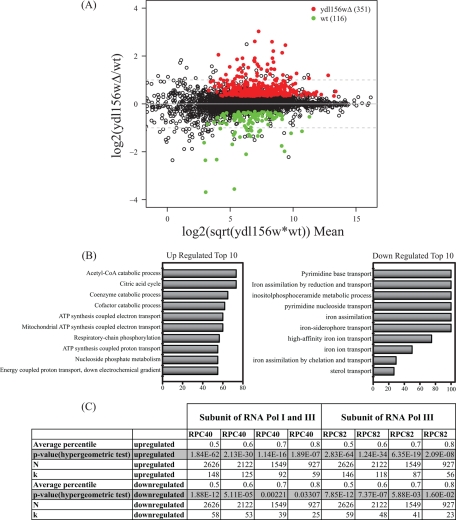
Fig. 6.
RNA-Seq analysis of gene expression in a ydl156w deletion strain. A, The results of comparing gene expression between wild type and ydl156w deletion cells are shown in the MA plot. The y axis represents the log2 ratio of expression values for ydl156w/wt, whereas the x axis represents the overall magnitude of the signal coming from both samples, calculated by the expression log2(sqrt(wt*ydl156w)). Values highlighted in color represent genes with an adjusted p value of less than 0.05. The number of genes enriched in ydl156w or wild-type by this criteria is indicated. The dash gray line represents a twofold difference in expression up or down. B, 10 most significant functional classes as determined by GOstat analysis in the group of up- and down-regulated transcripts. The x axis depicts the percentage relative to all transcripts of the functional class. C, Results of the hypergeometric test comparing the RNA-Seq data to the RNA Polymerase III ChIP-chip data performed by Roberts et al. (24). The p values indicating the statistical significance of enrichment of RNA Polymerase III occupied transcripts in the RNA-Seq data are reported for different average percentiles.

