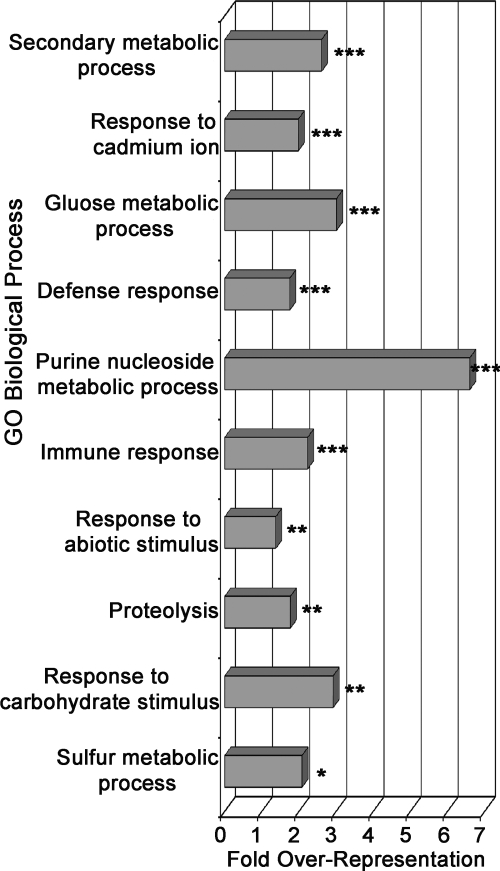
Fig. 3.
GO biological process over-representation in up-regulated proteins during ETI. The bar chart represents fold enrichment of GO biological process terms in the up-regulated protein set relative to background set of all identified proteins. The DAVID Bioinformatics Resources functional annotation clustering algorithm was used to cluster similar terms. The most significant representative term in each cluster is reported. The terms are ordered from most significant (top) to least significant (bottom). ***, p < 0.01; **, p < 0.05; *, p < 0.1.

