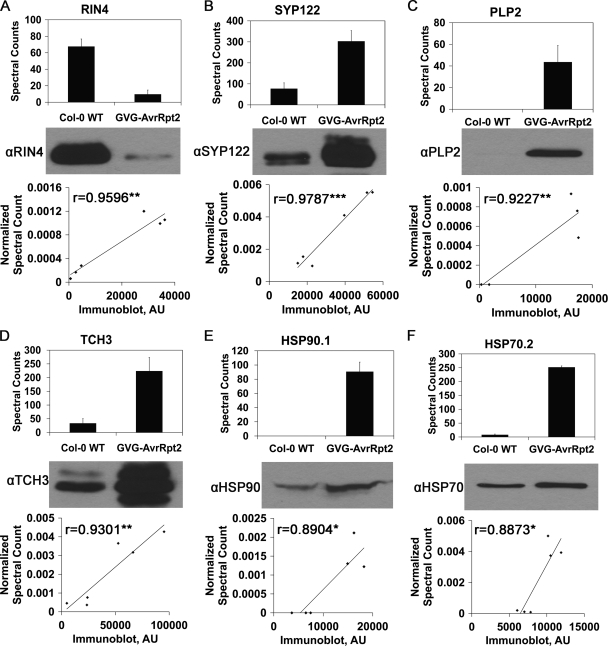
Fig. 5.
Protein spectral counts derived from MS/MS data correlate with immunoblot analysis. Top panels, bar chart of raw spectral counts in Col-0 WT and GVG-AvrRpt2 samples. The values are the means ± S.D. Middle panels, representative immunoblot of Col-0 WT and GVG-AvrRpt2 PM-enriched fractions. Bottom panels, correlation of immunoblot band intensity and normalized spectral counts in each sample. The Pearson correlation coefficients (r) are reported. ***, p < 0.001; **, p < 0.01; *, p < 0.05. Immunoblot band density was measured in arbitrary units (AU). The HSP90 and HSP70 antibodies recognize multiple protein isoforms. A, RIN4. B, SYP122. C, PLP2a. D, TCH3. E, HSP90.1. F, HSP70.2.

