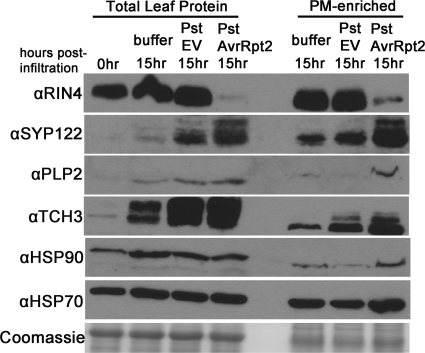
Fig. 6.
Spectral count data corresponds with protein changes during bacterial infection. Levels of differentially regulated proteins in proteomics analysis change similarly during P. syringae pv. tomato strain DC3000 (Pst) infection of Arabidopsis. Col-0 plants were vacuum infiltrated with 10 mm MgCl2 buffer, Pst expressing empty vector (EV), or Pst expressing AvrRpt2 at a concentration of 5 × 10⁷ cfu/ml. The plants were harvested at 15 h post-infiltration and subjected to aqueous two-phase partitioning for PM enrichment. Total leaf and PM-enriched fractions were subjected to immunoblot analysis with the indicated protein antibodies. Coomassie staining indicates equal protein loading across samples. Total protein amounts for each blot are as follows: RIN4, total leaf protein: 20 μg, PM-enriched: 1 μg; SYP122, total leaf protein: 20 μg, PM-enriched: 1 μg; PLP2, 10 μg; TCH3, 5 μg; HSP90, 45 μg; HSP70, 10 μg; Coomassie gel, 10 μg.

