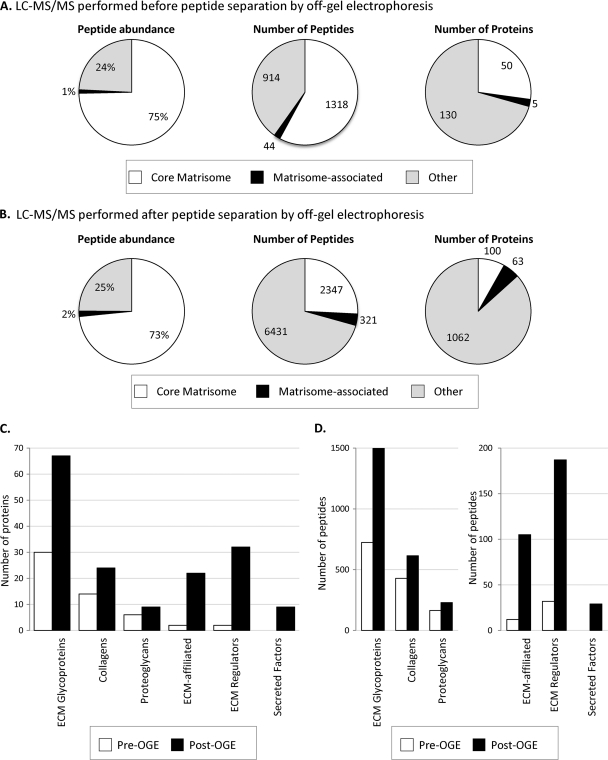
Fig. 2.
Characterization of the ECM of murine lung. A, Characterization of the ECM-enriched fraction from lung by LC-MS/MS proteomics. The pie charts display the results from one murine lung sample processed through the proteomics workflow. Proteins represented by at least two peptides were included in the analysis. Left panel shows the peptide abundance by precursor-ion MS signal corresponding to different protein categories. Middle panel: distribution in terms of numbers of peptides. Right panel: distribution in terms of numbers of proteins. The “core matrisome” division comprises ECM glycoproteins, collagens and proteoglycans; the “matrisome-associated” protein division encompasses ECM-affiliated proteins, ECM regulators and Secreted factors (see discussion in text and Fig. 3). MS data are presented in supplemental Table S1. B, Mass spectrometry results after peptide separation into 11 fractions by off-gel electrophoresis (OGE). The pie charts display the result of one murine lung sample processed through the proteomics workflow. Proteins represented by at least two peptides were included in the analysis. Left panel shows the peptide abundance by precursor-ion MS signal corresponding to the different divisions of the matrisome. Middle panel: distribution in terms of numbers of peptides. Right panel: distribution in terms of numbers of proteins. Note the increase in number of matrisome and matrisome-associated proteins detected in each category and the larger increase in nonECM proteins; that is, the increase in apparent “noise” relative to “signal” for ECM proteins. MS data are presented in supplemental Table S4A, sample 1. C, Comparison of the number of core matrisome and matrisome-associated proteins detected before and after peptide separation by OGE. D, Comparison of the number of peptides belonging to the core matrisome and matrisome-associated proteins before and after OGE.

