Fig. 4.
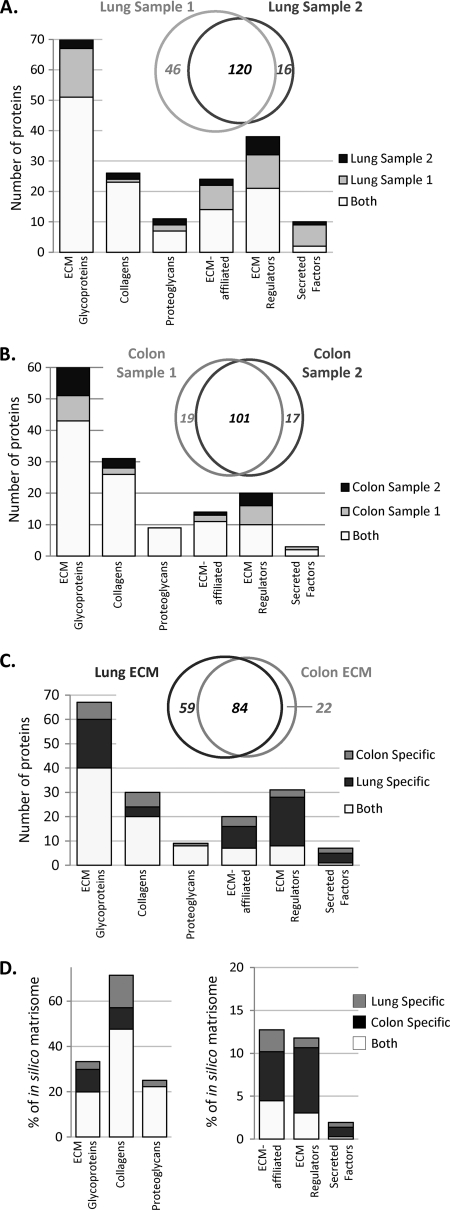
Reproducibility of the proteomic analysis. A, Two lung samples were analyzed through the proteomics pipeline and intersample variability was assessed. Venn diagram shows reproducibility in terms of number of matrisome proteins identified by two peptides in each of two independent samples. Bar chart represents the matrisome proteins detected in the two independent samples (see supplemental Table S4A). B, Two colon samples were analyzed through the proteomics pipeline and intersample variability was assessed. Venn diagram shows reproducibility in terms of number of matrisome proteins identified by two peptides in each of two independent samples. Bar chart represents the matrisome proteins detected in two independent samples (see supplemental Table S4C). C, Bar chart represents the overlap and tissue specificity for the lung and colon within each category of matrisome proteins. Venn diagram shows the number of matrisome proteins overlapping between the lung and colon and the number of tissue-specific matrisome proteins. Here, proteins are included only if they are found in both samples from a given tissue and represented by two peptides in at least one of them. D, Left panel: Comparison of the in vivo matrices of lung and colon core matrisome sets with the predicted in silico core matrisome. Right panel: Comparison of the in vivo lung and colon matrisome-associated sets of proteins with the predicted in silico matrisome-associated set of genes.

