. 2011 Dec 9;11(4):M111.014647. doi: 10.1074/mcp.M111.014647

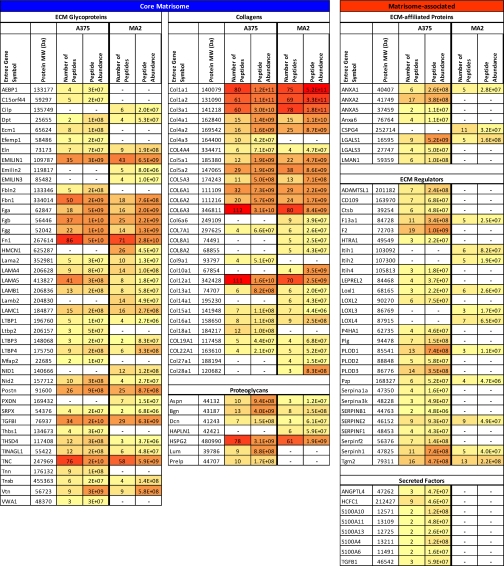
Table III. The tumor ECM changes with tumor's metastatic potential. Color code represents the number of peptides and total peptide precursor ion abundance of each protein in the two independent samples used to define the ECM compositions of non-metastatic (A375) and metastatic (MA2) human melanoma xenografts. Values used to generate the table were extracted from columns I (number of unique peptides) and J (peptide abundance) of supplemental Table S5B (A375) and supplemental Table S5D (MA2). Dash (—) indicates that the protein was not detected in either sample from a given tissue. Proteins included in this table were found in two independent samples with at least two peptides in one of the two samples. Uniprot accession numbers are given in supplemental Table S5.

graphic file with name zjw002124075t003.jpg