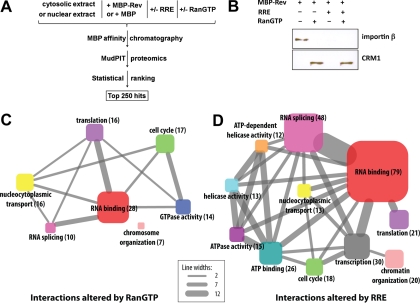
Fig. 1.
Proteomic analysis of Rev/RRE interacting host cell proteins. A, Flow diagram depicting the proteomic and statistical analyses. Cytosolic or nuclear extracts of HeLa cells were incubated with either MBP-Rev or MBP (control) in the presence or absence of RRE and/or RanQ69LGTP (denoted RanGTP hereafter). Certain experiments (not depicted) involved pretreatment of cytosolic extract without or with RNase prior to incubation with MBP-Rev or MBP. The complexes were adsorbed to amylose resin and eluted with maltose. Eluates were analyzed by MudPIT proteomics. Hits were scored by PCA and the list of the 250 top-scoring proteins was assembled. B, Western blot analysis of samples bound to MBP-Rev from cytosolic extracts. Samples were incubated with or without RanQ69L-GTP or RRE as indicated. C, D, GO term enrichments for proteins in the top 250 hits where the interactions with Rev were altered by the addition of RanGTP (C) or RRE (D). Only GO terms with an increased relative enrichment over the proteome are displayed. For simplicity, actins, tubulins, ribosomal proteins and histones were omitted from the graphs. Proteins lacking GO terms (such as predicted proteins) also were omitted. The size of a node reflects the number of proteins with that specific GO term (also indicated in parentheses) and the width of the lines connecting the various nodes reflects the number of proteins annotated with both respective GO terms at both ends of the lines, as designated by the scale.

