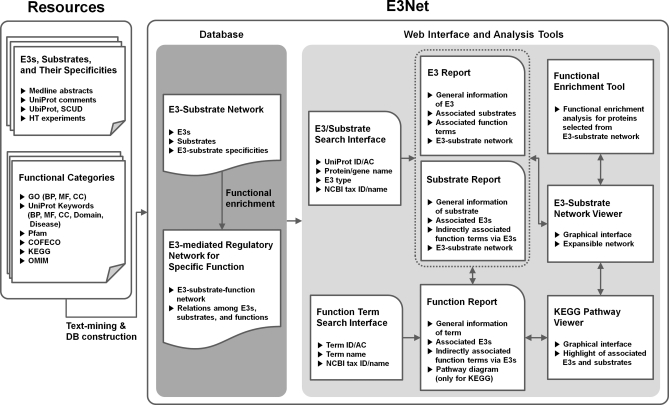
Fig. 1.
Schematic illustration of data collection, analysis, and representation of E3Net. E3s, substrates, and their specificities are extracted from textual resources and public ubiquitination data. The functional enrichment analysis of extracted E3-specific substrate groups identifies functional specificity of substrate groups with function terms in various public functional category resources. The E3-substrate network and their specific functions are organized to build a comprehensive database of the E3-mediated regulatory network for specific functions. The web-based system of E3Net provides search interfaces for E3/substrate and specific function term and displays outputs with organized text and graphical illustrations. In addition, the set of embedded analysis and navigation tools in E3Net enables a user to explore further characteristics of the E3-mediated regulatory network of their interest.

