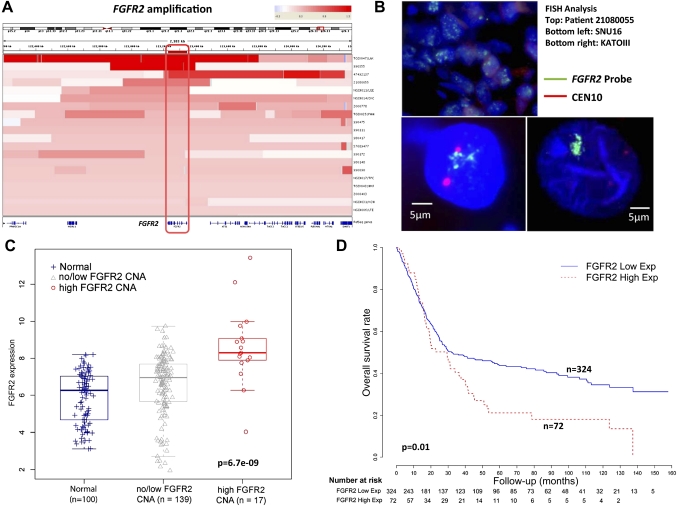
Figure 4.
FGFR2 gene amplification and messenger RNA expression in gastric cancer. (A) Heat-map showing the FGFR2 gene amplification region in individual gastric cancer samples (20 tumours). Each row indicates one gastric cancer sample with the amplified region in red. Intensity of the red bar indicates the level of copy number amplification. Genes located in this region are shown at the bottom. The intersection of these amplified regions covers only the FGFR2 gene (red box, gene outlined at bottom). (B) FGFR2 genomic amplification confirmed by fluorescence in-situ hybridisation (FISH). The photo displays a patient tumour (ID 21080055) with FGFR2 amplification and two FGFR2-amplified cell lines KATO-III and SNU16 confirmed by FISH analysis. Green signals indicate the FGFR2 FISH probe, red signals probes to centremore 10. (C) FGFR2 gene expression in clinical specimens. FGFR2 gene expression was compared across three categories, each represented by a box-plot: non-malignant gastric tissues (normal) (n=100); tumours exhibiting no/low FGFR2 CNA (n=139); and tumours exhibiting high FGFR2 CNA (n=17). mRNA comparisons were based on 156 gastric cancers in which gene expression data were available, representing a subset of the 193 gastric cancers analysed by single nucleotide polymorphism arrays. FGFR2 gene expression was inferred from Affymetrix microarrays (FGFR2 probe 211401_s_at). FGFR2 mRNA levels are significantly higher in samples with FGFR2 high CNA compared with the other two categories (p=6.7e-9, Kruskal–Wallis test). Tumours exhibiting FGFR2 amplification exhibit significantly increased FGFR2 gene expression compared with tumours exhibiting no/low FGFR2 CNA or non-malignant samples (p=1.9e-5 and 1.7e-7, Wilcoxon test). (D) Kaplan–Meier survival analysis comparing patients with tumours exhibiting high FGFR2 gene expression, defined as twofold higher than the average FGFR2 gene expression level in normal samples (72 tumours), with patients with tumours exhibiting low FGFR2 gene expression (total 398 patients, the 156 patients analysed in figure 4C are a subset of these 398 patients). Overall survival was used as the outcome metric.

