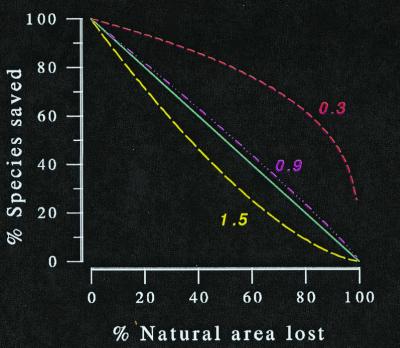
Figure 5.
Declining area reduces the proportion of species maintained at steady state. The amount of the reduction depends on the z-value. This figure shows the result for z-values of 1.5 (– – –), 1 (—), 0.9 (- ⋅ ⋅ ⋅ -), and 0.3 (- - -). Assuming the latter, which is a typical archipelagic z, we would predict the least severe losses. But data show that interprovincial z-values are close to unity.

