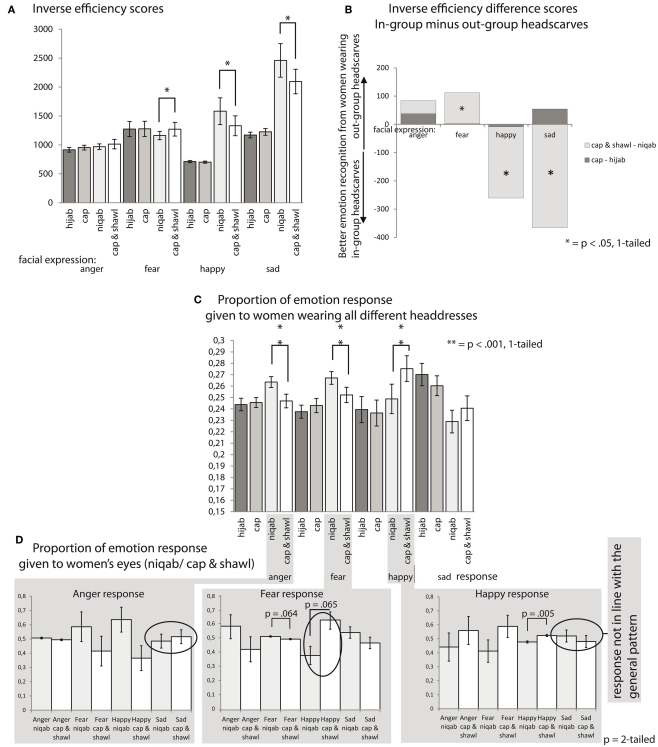
Figure 5.
(A) Inverse efficiency scores. The lower the number, the better the performance. Fear was better recognized from women wearing a niqāb vs. a cap and a shawl. Happiness and sadness were better recognized from women wearing a cap and a shawl than from women wearing a niqāb. (B) The graph shows difference scores from the “in-group minus out-group” inverse efficiency scores. The upper part of the graph shows conditions where the out-group was better recognized; the lower part where the in-group was better recognized, (C) the proportion of an emotion label given to a facial expression in different headdress-contexts (i.e., the number of fear responses to a niqāb divided by the total number of fear responses), (D) the proportion of an emotion label given to emotional eyes in the context of a niqāb or cap and shawl (i.e., the number of fear responses to a fearful face covered with a niqāb divided by the number of fear responses to a fearful face covered with a niqāb plus a cap and a scarf.

