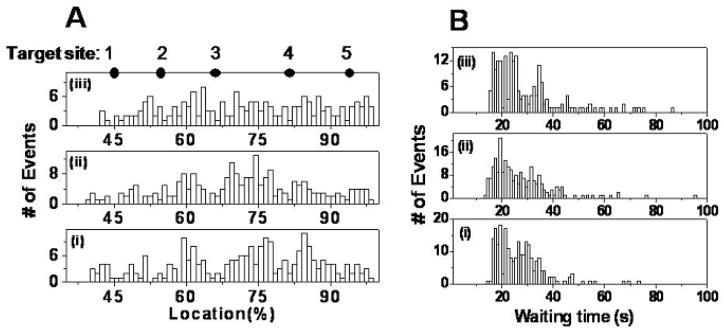
Fig. 3.
Control experiments. (A) Location distributions of the first cleavage events for three control experiments, ordered, from bottom to top: (i) DNA, with no enzyme or Mg2+ in channel a, and buffer with no enzyme or Mg2+ in channel b; (ii) DNA with no enzyme or Mg2+ in channel a, and buffer with [Mg2+]=2.0 mM in channel b; (iii) DNA with bound enzyme, with no Mg2+ in channel a, and buffer with no Mg2+ or enzyme in channel b. The solid dots indicate expected EcoRI target sites on fully stretched λ DNA numbered from 1 to 5. (B) Distributions of waiting time before the first cleavage event for three control experiments. From bottom to top: (i) <τ>=27.1s; (ii) <τ>=27.2s; (iii) <τ>=29.1s.

