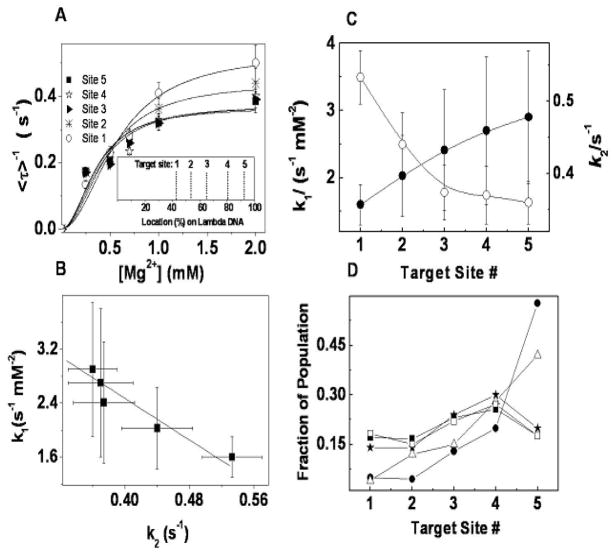
Fig. 4.
Kinetic analysis of cleavage. (A) Magnesium concentration dependence for five recognition sites of EcoRI on λ DNA. Each point is an average of > 60 cleavage events on the same recognition site. Solid lines are the fits with equation (4): k1 = 1.6 ± 0.3 s−1mM−2(site 1), 2.0 ± 0.6 s−1mM−2(site 2), 2.4 ± 0.9 s−1mM−2(site 3), 2.7 ± 1.1 s−1mM−2(site 4), 2.9 ± 1.0 s−1mM−2(site 5), and k2=0.53±0.04 s−1(site 1), 0.44±0.04 s−1(site 2), 0.38±0.04 s−1(site 3), 0.37±0.04 s−1(site 4), 0.36±0.03 s−1(site 5), respectively. Inset shows the digestion map of EcoRI on λ DNA. (B) The correlation between the parameters k1 and k2; and (C) the comparison between the parameters k1 and k2 obtained from [Mg2+] titration (● for k1 and ○ for k2) at each recognition site of EcoRI on λ DNA. (D) Average fraction of population for each target site: ■ from our experiments; △ from Ref. 21 with limited mixing; ★ from Ref. 21 with thorough mixing; □ from Ref. 21 with thorough mixing after scaling by k2; ● from Ref. 23. All the errors here are standard deviations.

