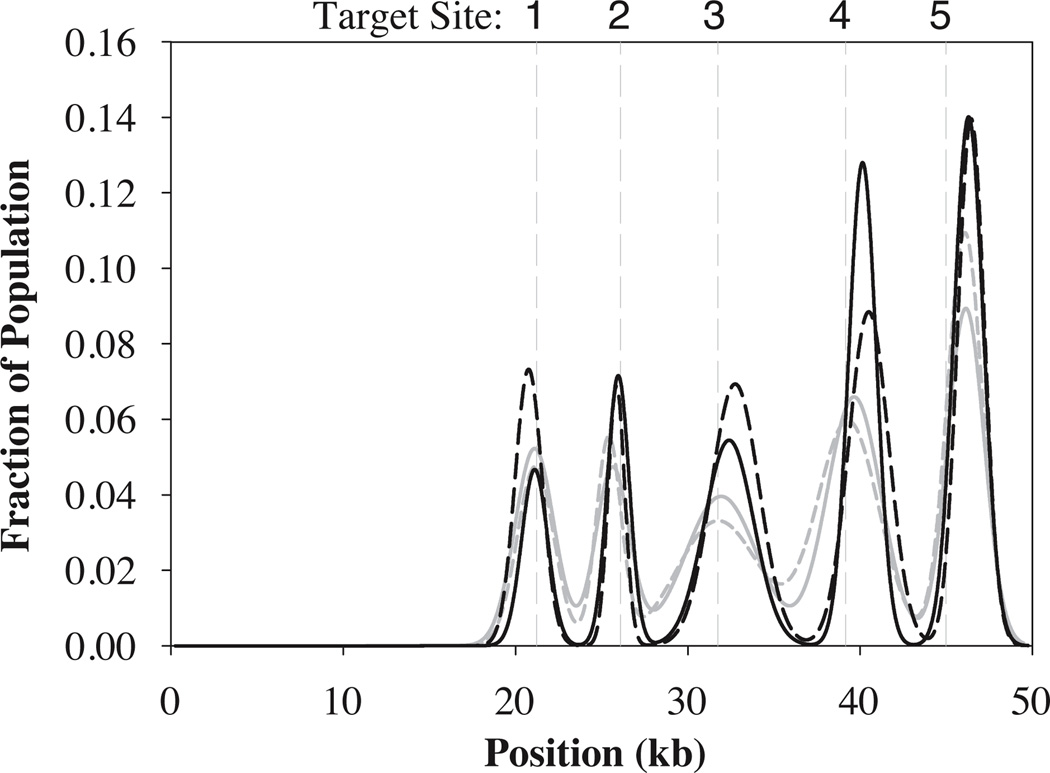
Figure 4.
Comparison of best Gaussian fits from binding distributions obtained from slide-stretched DNA (solid gray: 79% extension, broken gray: 92% extension) and flow-stretched DNA (solid black: De = 1, broken black: De = 3.9). Dashed vertical gray lines indicate expected target locations of EcoRI on fully extended λ-DNA.

