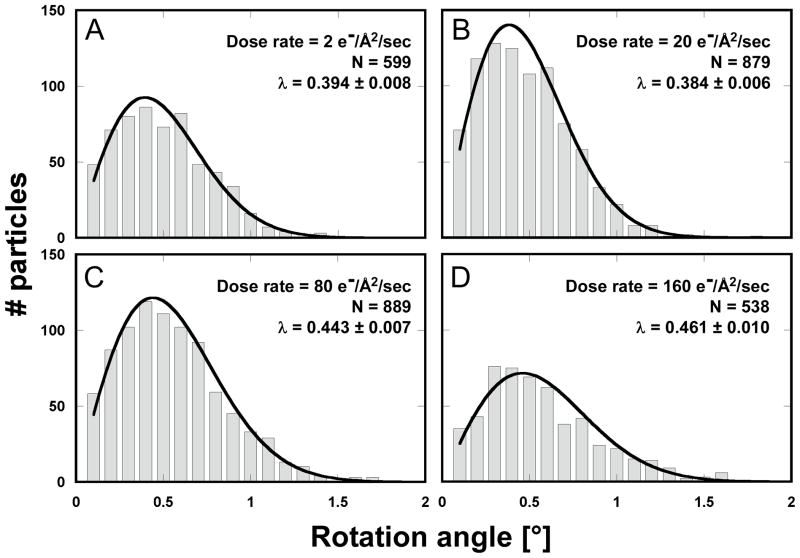
Figure 2.
Histograms for particle rotations measured between the first and second exposures of rotavirus DLPs in ice on C-flat™ 1.2/1.3 Cu 400 mesh grids (hole size = 1.2 μm). The dose applied in each exposure was 8 electrons/Å2. The dose rate varied between 2 and 160 electrons/Å2/sec, giving exposure times between 0.05 – 4 sec. The histograms were fitted with a Rayleigh distribution and maximum (λ) is indicated in each plot together with the total number of measurements.

