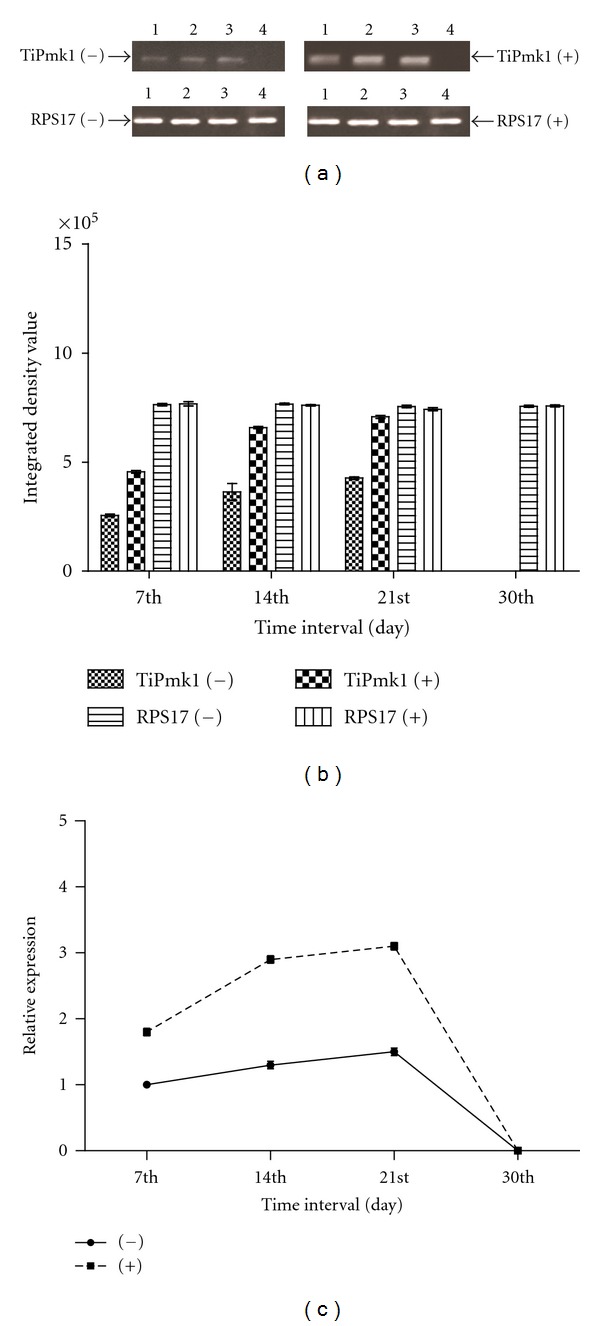
Figure 4.

(a, b and c) Expression analysis of TiPmk1 gene in T. indica isolate in absence of host factor (−) and in presence of host factor (+) at different days of growth and development in liquid culture. (a) Semiquantitative RT-PCR analysis—RT-PCR of expressed messenger RNA at the 7th, 14th, 21st, and 30th day (lane 1 to 4, resp.) with RPS17 rRNA transcript used as internal control. (b) Densitometry analysis-integrated density value based on densitometry analysis was done with the help of gene profiler software, Alpha Innotech Corporation USA. (c) Quantitative real-time PCR analysis—relative expression using real-time PCR.
