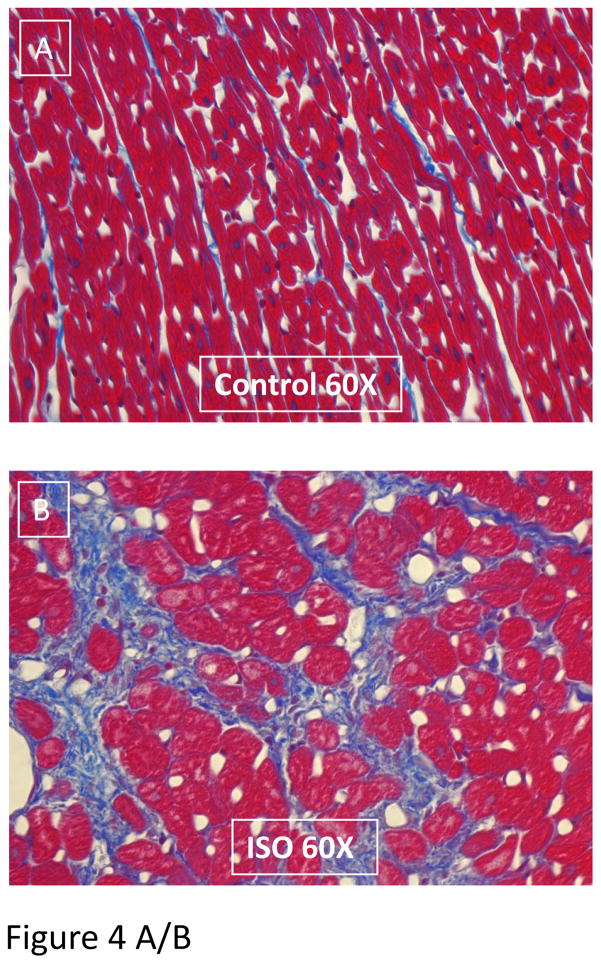
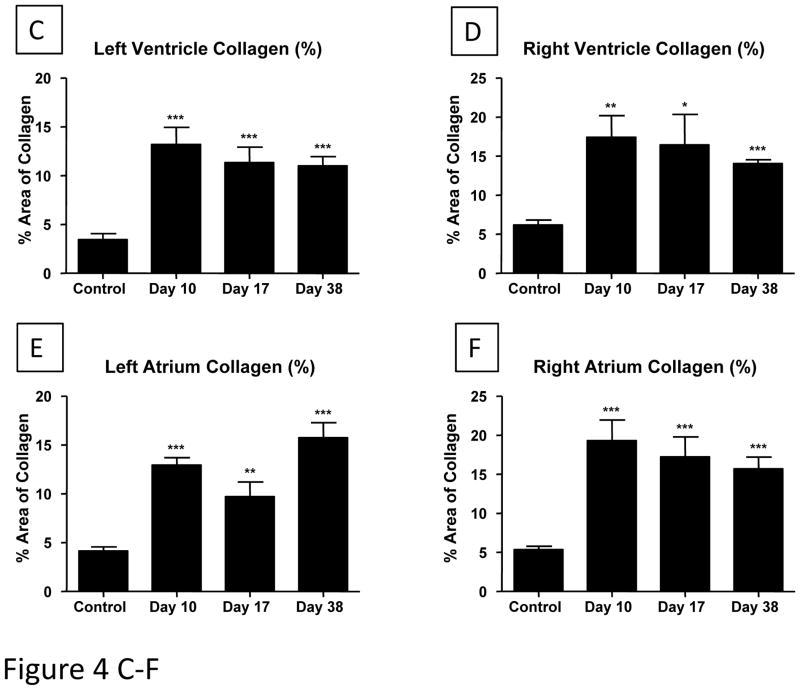
Figure 4. A/B. Representative LV tissue sections of control (A) and ISO damaged (B) hearts are shown.
Cell loss, myocyte hypertrophy and replacement fibrosis can be seen in ISO-treated heart tissue. Collagen (Blue); cardiac tissue (Red). The percent blue area was quantified. The collagen content of the ventricles (C/D) and atria (E/F) increase after ISO injury: Masson’s Trichrome stained slides were used to measure changes in collagen content of all cardiac chambers. The assessment and analysis of the data was carried out in a blinded fashion. All chambers had significant increases in collagen content after ISO injury (Day 10), with small reductions during the next few weeks. Control-Day 10 (N=7); Day 17-Day 38 (N=6). *P<0.05; **P<0.01; ***P<0.001 versus Control. Data are presented as mean ± SEM.


