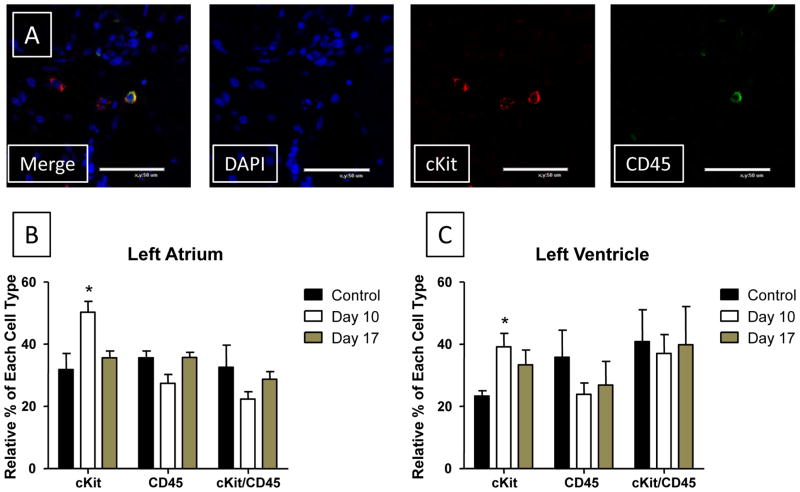
Figure 8. The % of cKit+/CD45- cells increases during ISO induced injury.
A: Representative staining of tissue for cKit, CD45 and DAPI. Three cKit cells are present and one of these was also positive for CD45. B/C: Tissue sections from Control, Day 10 ISO-treated and Day 17 ISO-treated hearts were co-stained with cKit and CD45. Cells that stained positive for cKit only, CD45 only and with both cKit and CD45 were each counted. The percent of each cell type present (cKit+ only, CD45+ only, or cKit+/CD45+) relative to the group as a whole is plotted for Atrial (B) and Ventricular (C) sections. cKit (Red); CD45 (Green); DAPI (Blue). Control (N=3) Day 10 (N=4); Day 17 (N=3). *P<0.05; **P<0.01; ***P<0.001 versus Control. Data are presented as mean ± SEM.

