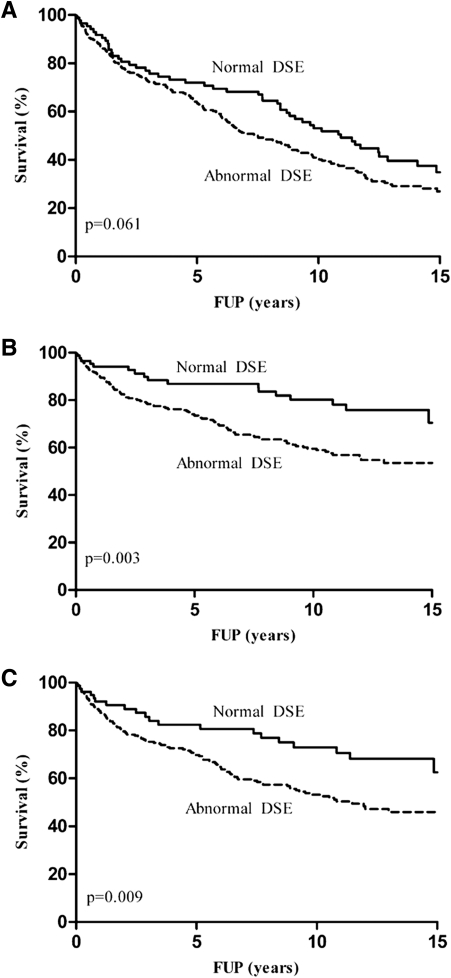
Figure 2.
Kaplan-Meier survival curves with normal vs. abnormal DSE for all end points of interest. A: All-cause mortality: normal 88, 58, 41, and 12; abnormal 308, 164, 99, and 20 patients at risk at start, 5-, 10-, and 15-year follow-up (FUP), respectively. B: Cardiac death: normal 88, 58, 41, and 12; abnormal 308, 164, 99, and 20 patients at risk at start, 5-, 10-, and 15-year FUP, respectively. C: Hard cardiac events: normal 79, 48, 32, and 10; abnormal 296, 146, 82, and 20 patients at risk at start, 5-, 10-, and 15-year FUP, respectively.

