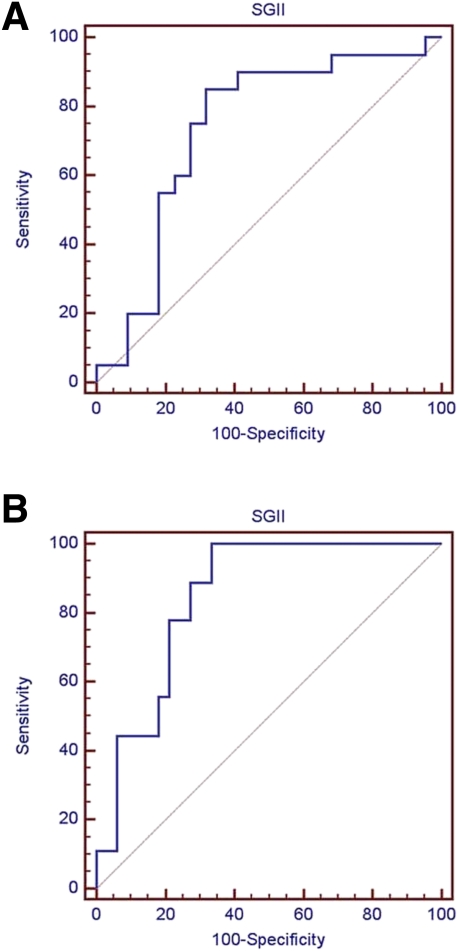
Figure 3.
ROC curve analysis of SGII. The graphs show the ROC curves of SGII for diagnosing autonomic neuropathy (A) and for classifying diabetic patients with anhidrotic symptoms (B). A: The AUC was 0.736 (95% CI 0.578–0.860) for autonomic neuropathy. B: The AUC was 0.845 (0.700–0.938) for anhidrotic symptoms. (A high-quality color representation of this figure is available in the online issue.)

