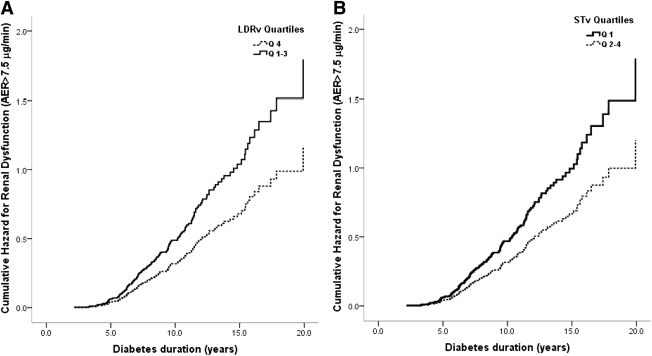
Figure 1.
A: Cumulative hazard curves for risk of early renal dysfunction by LDRv quartiles: quartile 4 vs. quartiles 1–3 (HR 2.0 [95% CI 1.3–2.9]) adjusted for sex, A1C, and DBP SDS. B: Cumulative hazard curves for risk of early renal dysfunction by STv: quartile 1 vs. quartiles 2–4 (1.5 [1.1–2.1]) adjusted for sex, A1C, and DBP SDS.

