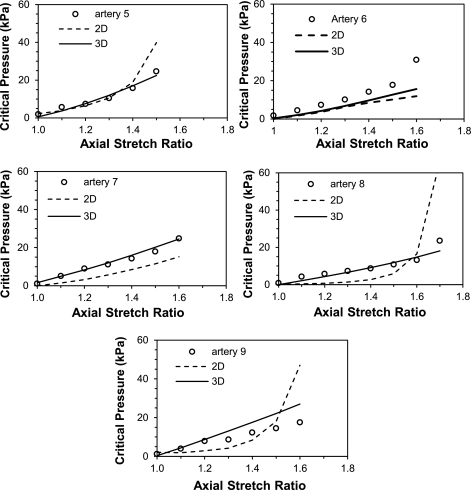
Fig. 4.
Comparisons of critical buckling pressures from experimental measurement (○) and two-dimensional (2D) and 3D model predictions (dahsed and solid lines, respectively) for five arteries in the normal group. The model predictions were obtained for each individual artery by using the material constants given in Tables 2 and 3 and vessel dimensions given in Table 1 as inputs into the buckling equation.

