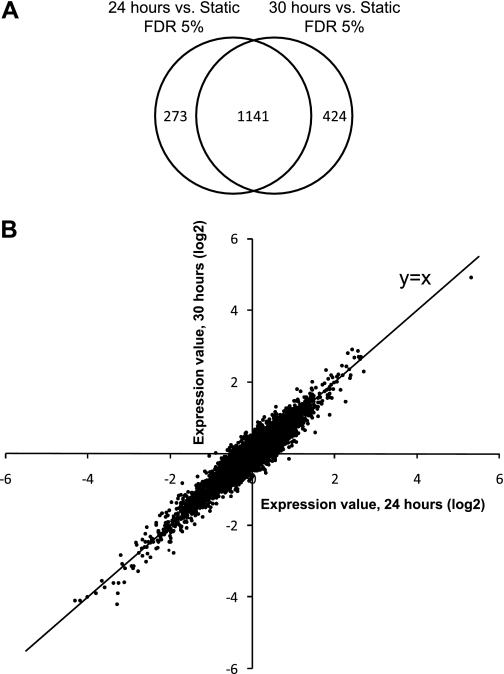
Fig. 2.
Gene expression of endothelial cells exposed to 24 and 30 h of basal shear stress. A: Venn diagram displaying the overlap of differentially expressed genes identified at 24 and 30 h (relative to static controls). B: scatter plot of gene expression profiles. Expression value of each gene was normalized by the corresponding static control value. x: Expression value after 24 h of shear stress; y: expression value after 30 h of shear stress.

