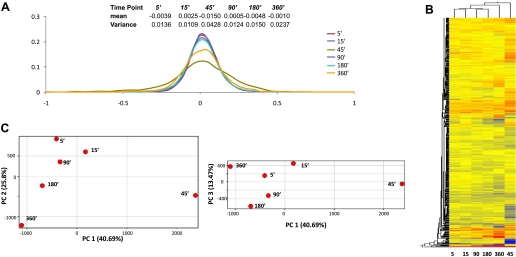
Fig. 4.
A: statistical summary and histograms of the transcriptional profiles at each time point. B: hierarchical clustering of the global expression profiles at all time points. C: principal component analysis. Principal component 1 (PC1) contains 40.69% of the total variance. PC2 and PC3 contain 25.80 and 13.47% of the total variance, respectively. Each time point is plotted in the projected planes of PC1 vs. PC2, and PC1 vs. PC3.

