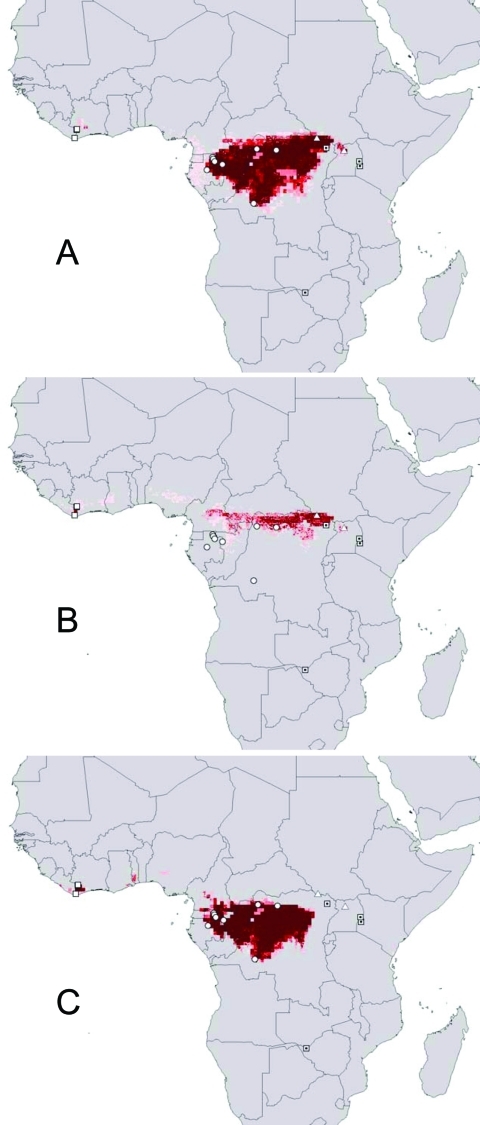
Figure 2.
Geographic projection of ecologic niche models in which two Ebola virus species were modeled and used to predict the distributional area of the third. (A) Ebola Zaire and Ebola Sudan predicting (Ebola Ivory Coast omitted; note that distributional area is predicted in Ivory Coast). (B) Ebola Sudan and Ebola Ivory Coast predicting (Ebola Zaire omitted). (C) Ebola Zaire and Ebola Ivory Coast predicting (Ebola Sudan omitted). Darker shades of red represent increasing confidence in prediction of potential presence. Open squares, Ebola Ivory Coast; circles, Ebola Zaire; triangles, Ebola Sudan; dotted squares, Marburg hemorrhagic fever occurrences.

