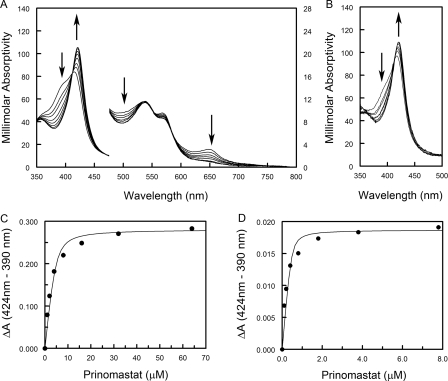
FIGURE 2.
Concentration-dependent effects of prinomastat on P450 2D6 isolated in the presence of 50 μm thioridazine. The concentrated P450 2D6 thioridazine complex in buffer containing 120 mm potassium phosphate, pH 7.4, 20% v/v glycerol, 10 mm β-mercaptoethanol, 14 mm CHAPS, and 50 μm thioridazine was diluted into buffer containing 120 mm potassium phosphate, pH 7.4, and 20% v/v glycerol. A, prinomastat in DMSO was added in small increments to final concentrations of 1, 2, 4, 8, 16, 32, and 64 μm to 4.6 μm P450 2D6 thioridazine complex (100-fold dilution). The maximum concentration of DMSO was 0.07% v/v. The scale for the apparent millimolar absorptivity is shown on the left for wavelengths below 477 nm and on the right for longer wavelengths. B, prinomastat was added to 0.46 μm of the P450 2D6 thioridazine complex (1000-dilution). Only the Soret region is shown. The proportion of high spin P450 is reduced at this concentration of the protein based on the lower ratio of absorbance at 390 nm relative to 424 nm. The final concentrations of prinomastat were 0.1, 0.2, 0.4, 0.8, 1.8, 3.8, and 7.8 μm. The maximum concentration of DMSO was 0.02% v/v. The arrows indicate the direction of change in response to addition of each ligand in A and B. Difference spectra were calculated for the spectra in A and B, and the differences of absorbance between 424 and 390 nm were plotted versus the final concentration of prinomastat in C and D, respectively. The binding curves were computed by nonlinear least squares regression to estimate values of ΔAmax and Kd using the quadratic form of the binding equation. Estimates of the Kd values for multiple determinations are reported in the text.

