FIGURE 4.
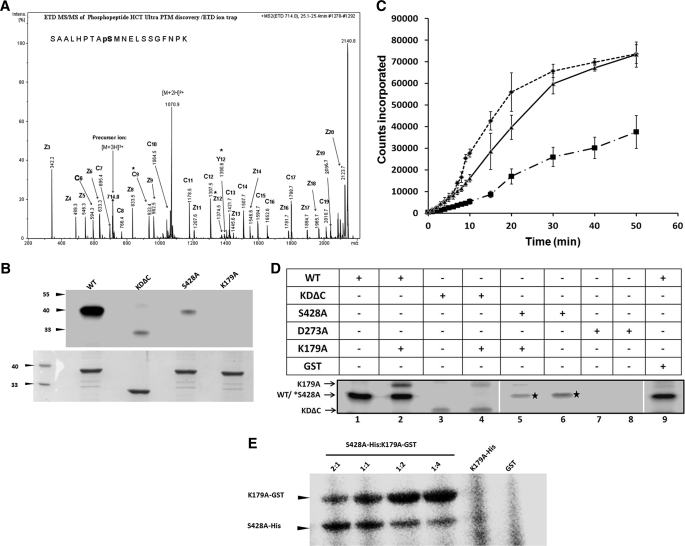
Identification and characterization of autophosphorylation site. A, ETD spectrum showing the site and sequence of the phosphorylated peptide. LC-ESI-ETD MS/MS spectrum of [M+3H]3+ precursor ion m/z 714.0 matched z+1, z+2 and c-fragment ions are indicated in the spectra, and in the peptide sequence, the 9th serine is found to be phosphorylated. * indicates phosphorylated ions. B, autophosphorylation of wild type, KDΔC, and S428A mutants in the presence of [γ-32P]ATP. C, time course for substrate phosphorylation activity of purified wild type (dotted line), S428A (dots with dash line), and S428E (solid line) kinase domain of EhC2PK. D, autophosphorylation of kinase domain of EhC2PK by cross phosphorylation reaction. E, trans-phosphorylation with a constant amount of donor (His-tagged S428A) and varying amounts of acceptor (GST-tagged K179A).

