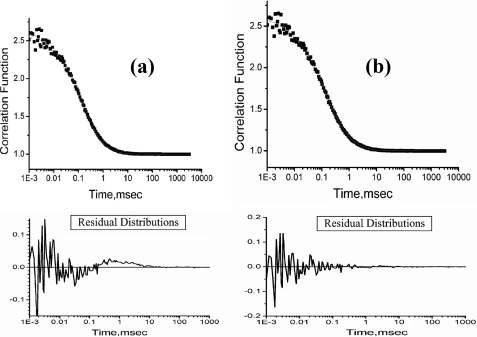
FIGURE 1.
a, representative correlation function obtained by FCS experiments with on average a single cytochrome c-TMR molecule at pH 2. The fit of this data to Equation 1 yields non-random behavior of the residual distribution (shown at the bottom of the figure) suggesting that Equation 1 may not be appropriate. b, correlation function obtained with cytochrome c-TMR at pH 2 could be fit successfully to Equation 2. Residual distribution calculated using Equation 2 (shown at the bottom of the figure) is completely random, indicating the goodness of the fit.

