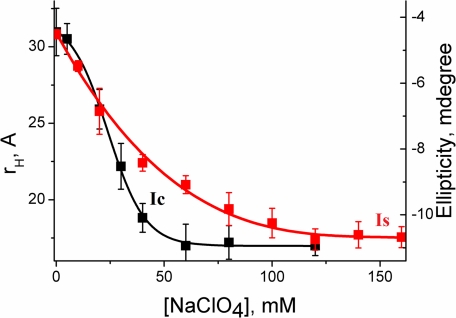
FIGURE 3.
The comparison between the formation of collapsed state (IC) and that of secondary structure (IS). The formation of IC has been monitored by rH using FCS data (black squares), whereas far UV CD at 222 nm (red squares) has been used to monitor the formation of IS. The data containing the variation of rH with sodium perchlorate concentration has been fit to a two-state unfolding transition as shown by the black line. The line through the CD data (red line), on the other hand, is for the presentation only and not a fit using a physically validated equation. All measurements have been carried out at pH 2.

