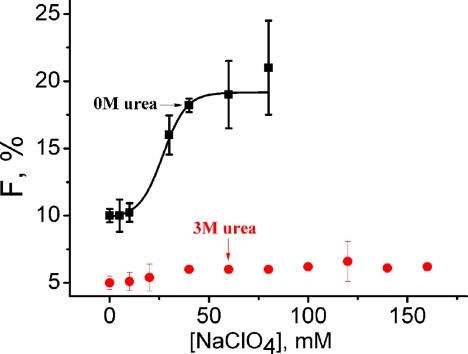
FIGURE 5.
The variation of amplitude of τR (F, %) of cytochrome c at pH 2 with sodium perchlorate concentration in the absence (black) and presence (red) of 3 m urea. A large increase in F with the salt concentration has been observed in the absence of urea, whereas no significant change is present in the presence of 3 m urea.

