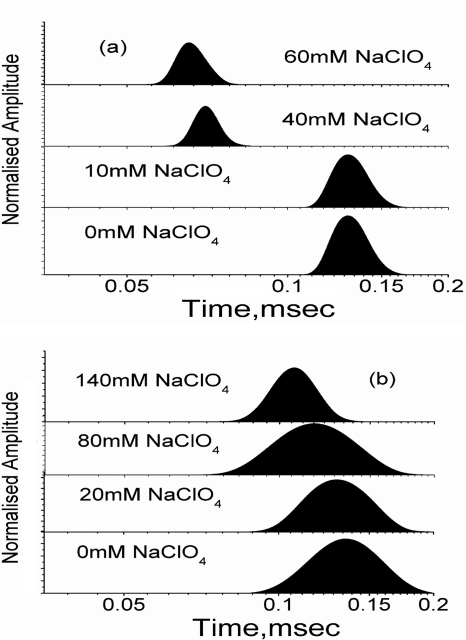
FIGURE 6.
The variation of the maximum entropy profiles of cytochrome c-TMR with sodium perchlorate concentration in the absence (a) and presence (b) of 3 m urea at pH 2. In the absence of urea, the maximum entropy profiles shift sharply toward lower diffusion time as IC forms. This behavior of maximum entropy profiles is not consistent with the homopolymer collapse hypothesis. In the presence of urea, however, IC forms slowly and gradually over an extended range of sodium perchlorate concentration, as expected for a homopolymer collapse.

