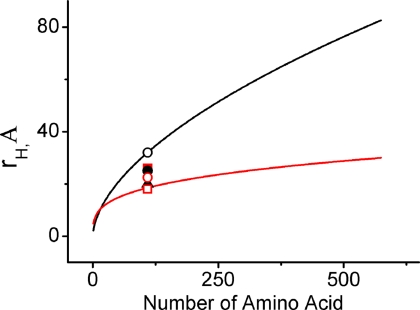
FIGURE 9.
The calculated variation of the hydrodynamic radii of different proteins with the number of residues for the extended unfolded states in the good solvent (black) and the native states in the poor solvent (red). The rH values determined from the present FCS measurements at different solution conditions are also shown. These are unfolded state (black open circles), native state (black filled triangles), IC in the absence (red open squares) and presence of 1 m urea (red open circles), 3 m urea (black filled circles) and 4 m urea (red filled squares).

