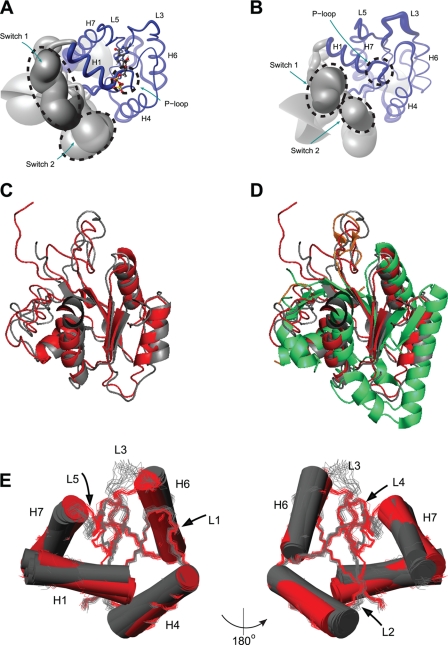
FIGURE 3.
Structures of GDP-bound and apo-IF2-G2. A, “sausage” representation of the IF2-G2·GDP NMR ensemble. The thickness of the backbone represents the r.m.s.d. Structural elements are indicated; GDP is shown in “ball-and-stick.” B, sausage representation of apo-IF2-G2. C, backbone overlay of the best structures of the NMR ensembles calculated for apo- (gray) and GDP-bound (red) IF2-G2. D, as C, additionally overlaid with the crystal structure of the G2 domain from M. thermoautotrophicum aIF5B (green). E, different orientations of the reorganization within the B. stearothermophilus IF2-G2 domain between its apo-state (gray) and GDP-bound (red) state.

