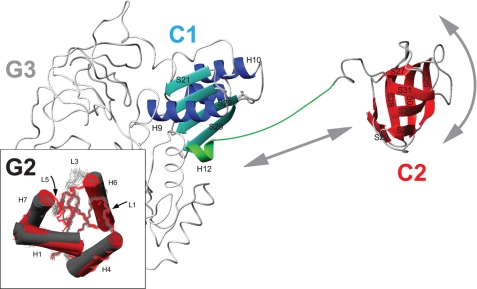
FIGURE 5.
Model for the positional mobility of B. stearothermophilus IF2-C2. The figure shows a backbone representation of B. stearothermophilus IF2 C1-C2. Domain connector “H12” (Arg622–Lys646) is shown in green, and residues belonging to IF2-C1 are blue, and residues forming IF2-C2 are in red. The G23 domains are shown (in gray) based on sequence homology and crystal structures of M. thermoautotrophicum aIF5B. Arrows indicate the motional freedom of the C2 domain compared with the rest of the protein. The inset shows the structural changes detected for IF2-G2 upon GDP binding.

