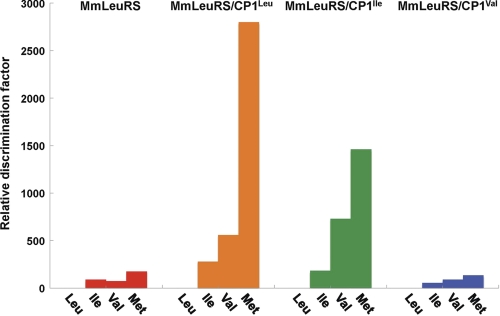
FIGURE 3.
Bar graph representing amino acid discrimination factors relative to leucine. Data for M. mobile LeuRS are shown in red, whereas data for hybrid proteins MmLeuRS/CP1Leu, MmLeuRS/CP1Ile, and MmLeuRS/CP1Val are shown in orange, green, and blue, respectively. This graph is based on the measurements listed in supplemental Table S1.

