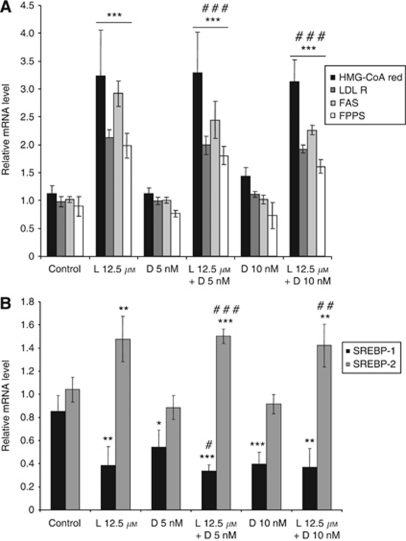
Figure 2.
Effect of lovastatin and docetaxel on lipid synthesis gene expression levels. HGT-1 cells were treated with 12.5 μM lovastatin (L12.5) or with 5 or 10 nM docetaxel (D5 or D10) alone or in combination for 48 h. HMG-CoA reductase (HMG-CoA red), LDL receptor (LDL-R), fatty acid synthase (FAS), FPP synthase (FPPS) (A) and SREBP-1 and SREBP-2 (B) mRNA levels were analysed by real-time RT–PCR (see Materials and Methods). Relative mRNA levels were normalised to P0 mRNA levels. Values are means±s.d. (n=4). *Compared with control and #compared with docetaxel treatment. One symbol: P<0.05, two symbols: P<0.01, three symbols: P<0.001 (Student's t-test).

