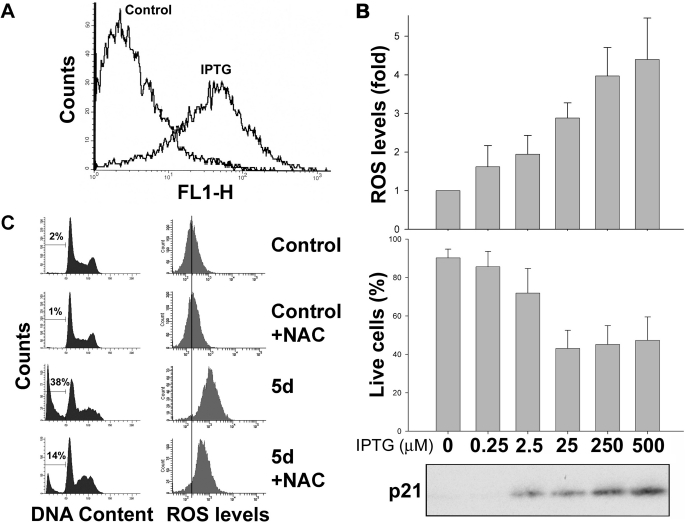
FIGURE 2.
Increase in intracellular ROS correlates with p21 induction of apoptosis in HT1080p21–9. A, FACS analysis of DCF-stained HT1080p21–9, 5 days after exposure to 25 μm IPTG, compared with untreated cells. B, HT1080p21–9 exposed to from 0 to 500 μm IPTG for 5 days. Top panel, ROS levels compared with untreated cells, measured by DCF staining. Middle panel, percentage of live cells as measured by annexin/PI staining. Cells that were both annexin-negative and PI-negative (lower left quadrant) were considered alive. Bottom panel, immunoblot of p21 protein expression. C, left panels, FACS analysis of PI-stained HT1080p21–9, uninduced or 5 days after p21 up-regulation, in the presence or absence of 10 mm NAC. Cells were cultured in the presence of NAC for the duration of the experiment, and NAC was added every time the medium was changed. Right panels, FACS analysis of the same cells stained with DCF. The gray vertical line indicates mean fluorescence intensity of control cells.

