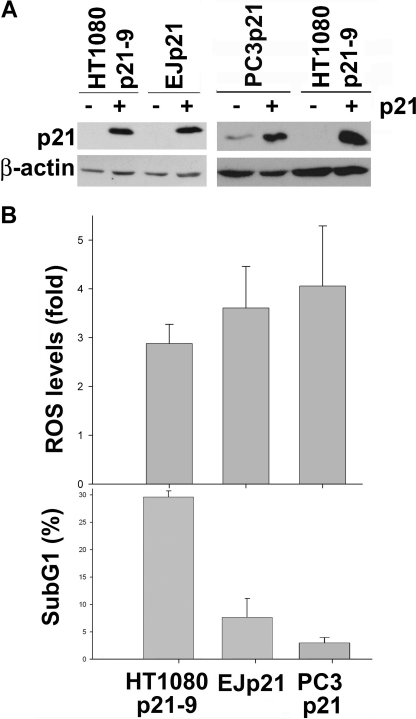
FIGURE 3.
Cell fate decisions after p21 up-regulation do not depend on differences in p21 expression or ROS levels. A, immunoblot analysis of HT1080p21–9, EJp21, and PC3p21 uninduced (−) and induced to express p21 for 5 days (+). B, top panel: intracellular ROS levels as measured by DCF staining of HT1080p21–9, EJp21, and PC3p21 cells induced for 5 days. Bars represent fold changes in mean fluorescence intensity from control to induced cells. Bottom panel, percentage of events in the sub-G1 phase, as measured by PI staining of the same cells.

